Sections: Introduction -> Survey Details -> Sample Information -> Survey Items -> Hypotheses and Analyses of Models -> Conclusion
The YouGov panel is comprised of more than 360,000 respondents who have opted-in to answer surveys for the company. Such respondents are recruited through the YouGov website as well as through advertising on other websites, and the company makes extensive efforts to recruit underrepresented groups to the panel. Nevertheless the sample, though drawn at random from the YouGov panel, is not a random sample of the United Kingdom population. Comparing the sample to the 2011 Census data we can see that the sample is broadly representative of the British population in terms of sex and region of residence. However, the sample is less representative in terms of age, ethnicity, and religion.
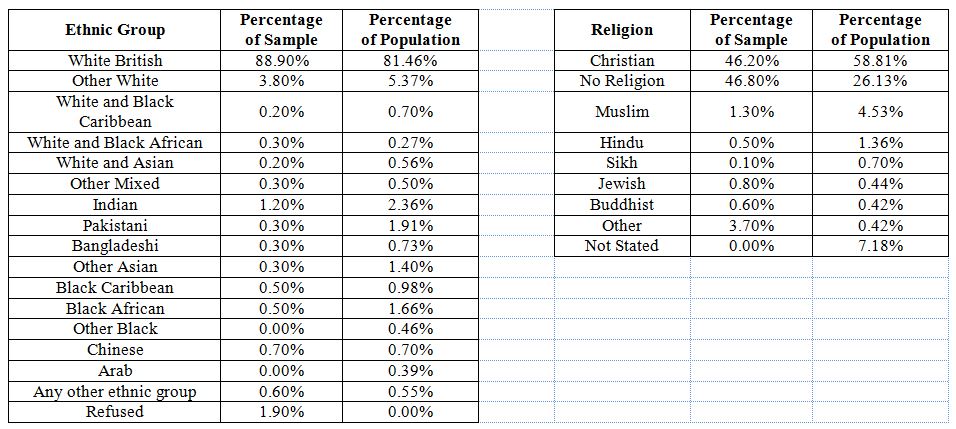
YouGov does not recruit panellists who are below the age of 18 which explains the low proportion of respondents in the 15-19 cage category defined by the Census. Putting this aside it remains the case that younger people (below the age of 30), older people (over the age of 75) and, less dramatically, people in their forties are underrepresented. By contrast respondents in their thirties and especially in their fifties and sixties are overrepresented in the sample. In terms of ethnicity, White British people are overrepresented in the sample whilst almost every other ethnic group is underrepresented. The story is a similar one in relation to religion, with respondents with no religion overrepresented and all other religious groups underrepresented in the sample.
Table 3 – Comparison of
Sample and Population Sex
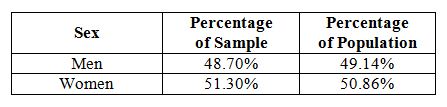
Table 4 – Comparison of Sample Table 5 – Comparison of Sample
and Population Region of Residence and Population Age Categories
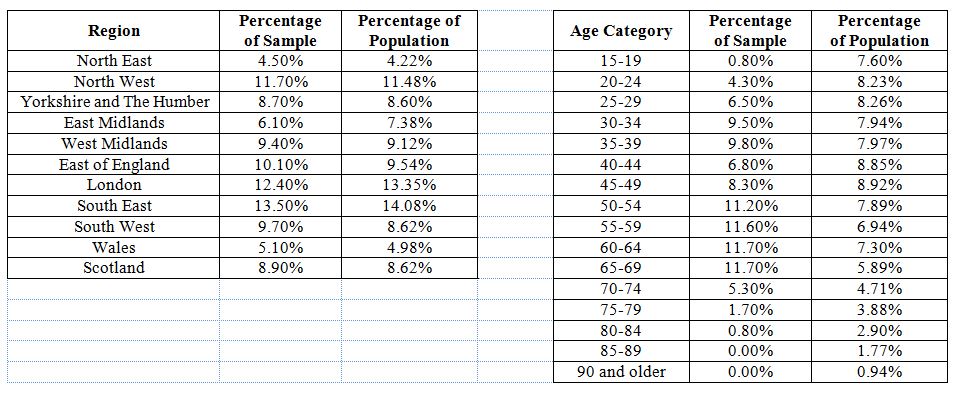
Table 6 – Comparison of Sample Table 7 – Comparison of Sample
and Population Ethnic Group and Population Religious Group
The fact that the sample is not representative of the British population may have implications for any findings emerging from the subsequent analysis, especially if the goal is to generalise those findings to the population. However, representativeness of samples is more important when presenting descriptive statistics than it is when examining causal relationships. This has been demonstrated in an article by David Sanders, Harold D. Clarke, Marianne C. Stewart, and Paul Whiteley.[1] They conducted a survey experiment in which a face-to-face survey was fielded to a clustered probability sample whilst a self-completion survey containing the same questions was fielded online to a sample of YouGov panellists. Analysis of the resulting data revealed significant but minimal differences in the levels of party support indicated by the two samples. By contrast, the significant variables emerging in models of voting behaviour were almost all the same. Based on those findings, and given that the goal of the current research is to test models of political behaviour rather than to describe distributions in the population, it is reasonable to utilise the survey data gathered despite its lack of representativeness.
Sections: Introduction -> Survey Details -> Sample Information -> Survey Items -> Hypotheses and Analyses of Models -> Conclusion
[1][1] David Sanders, Harold D. Clarke, Marianne C. Stewart, and Paul Whiteley, ‘Does Mode Matter for Modeling Political Choice? Evidence from the 2005 British Election Study’, Political Analysis, Vol. 15, No. 3 (Summer, 2007), pp. 257-285.

5 thoughts on “Interim Survey Data Analysis: Sample Information”